
Mobile device usage is said to exceed desktop/laptop usage in the near future. The mobile web is expected to grow exponentially as a result. This post covers setting up the mobile developer tools included in Google Chrome to debug mobile web pages running on Android. Being able to debug your mobile web pages on an actual device is the best way to see how your pages will look and behave. Google provides excellent facilities for this. To do this you’ll need a desktop or laptop, an Android device and a USB cable to connect them together.
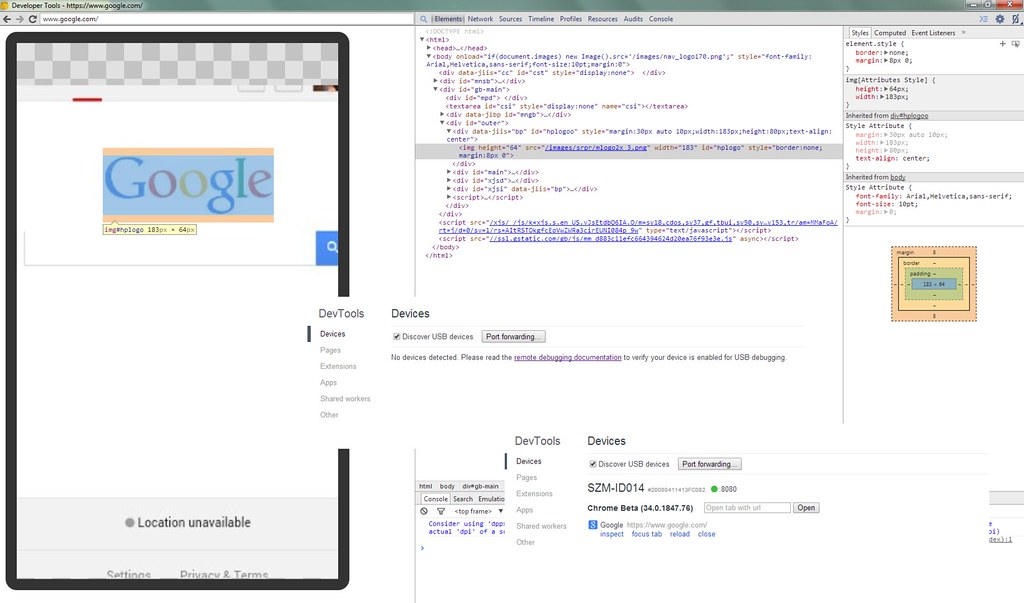
Debugging google.com using Chrome Canary and Chrome Beta on Android
Debug mobile pages running on your Android device from the desktop setup steps
- Install Google Chrome Canary. You cannot inspect the page running on the Android without this debug build installed on your development box. (regular Google Chrome will not allow you to inspect the page)
- Install Google Chrome Beta on your Android
- Enable Developer Mode on your Android device
- Enabling developer mode on your Android device differs from build to build.
- The most common way is to go to Settings->About(device or tablet) and scroll down to the Build Number. Then click on it seven times. You should see a popup after the first few clicks indicating how many times you have to continue to enable developer mode.
- If that does not work consult your Android documentation.
- If all else fails install the USB Debug application from the play store (this worked for me on Android 4.04)
- Now you must enable USB Debugging which is listed under the Developer options menu item inside the Settings menu on the Android. (If you installed the USB Debug application – just run the app and choose it from there)
- On your development box (laptop, desktop,..) start up Canary and open a Tab to chrome://inspect
- On the Android start up Chrome Beta and open up a page (any page will do just to get started)
- Now plug the Android device into your development system with the USB cable.
- Back on your development system, on the chrome://inspect page make sure the Discover USB Devices box is checked and wait for your device to show up in the list below.
If you followed the outline above you should see your Android device listed along with any open tabs that may be open in Google Chrome Beta on the Android. From your development desktop you now have complete control over Google Chrome Beta on on your Android. You can open new tabs, reload a tab, close a tab, and inspect the document opened in a tab with Chrome developer tools. Once you start inspecting pages you can screencast what is displayed on the Android by hitting the mobile icon on the inspector toolbar. Now, you can inspect elements graphically on the screencast screen.
Debugging development server mobile pages on your Android device
In order to set up debugging your mobile pages from a local server on your Android device you must enable port forwarding inside of Canary on your development box.
- Set up your local server to use port 8080 as default is the easiest way as Chrome Canary has that set by default.
- On Apache edit the httpd.conf to default to 8080 instead of 80
- If you’re entering a new port forwarding entry you cannot use port 80 or 443 – Chrome Canary will not allow you to set up port forwarding on them.
With that out of the way you should be able to open up pages hosted on your local development server on your Android device for debugging. There you have it – short n sweet ;^>
References
- Remote Debugging Chrome on Android – https://developers.google.com/chrome-developer-tools/docs/remote-debugging
- USB Debug App – https://play.google.com/store/apps/details?id=me.tennkia.apr
- Google Chrome Canary – https://www.google.com/intl/en/chrome/browser/canary.html
- Google Chrome Beta for Android – https://play.google.com/store/apps/details?id=com.chrome.beta
- UDACITY (cs256 – Mobile Web Development) – https://www.udacity.com/
